proprietary data
for P&C insurance
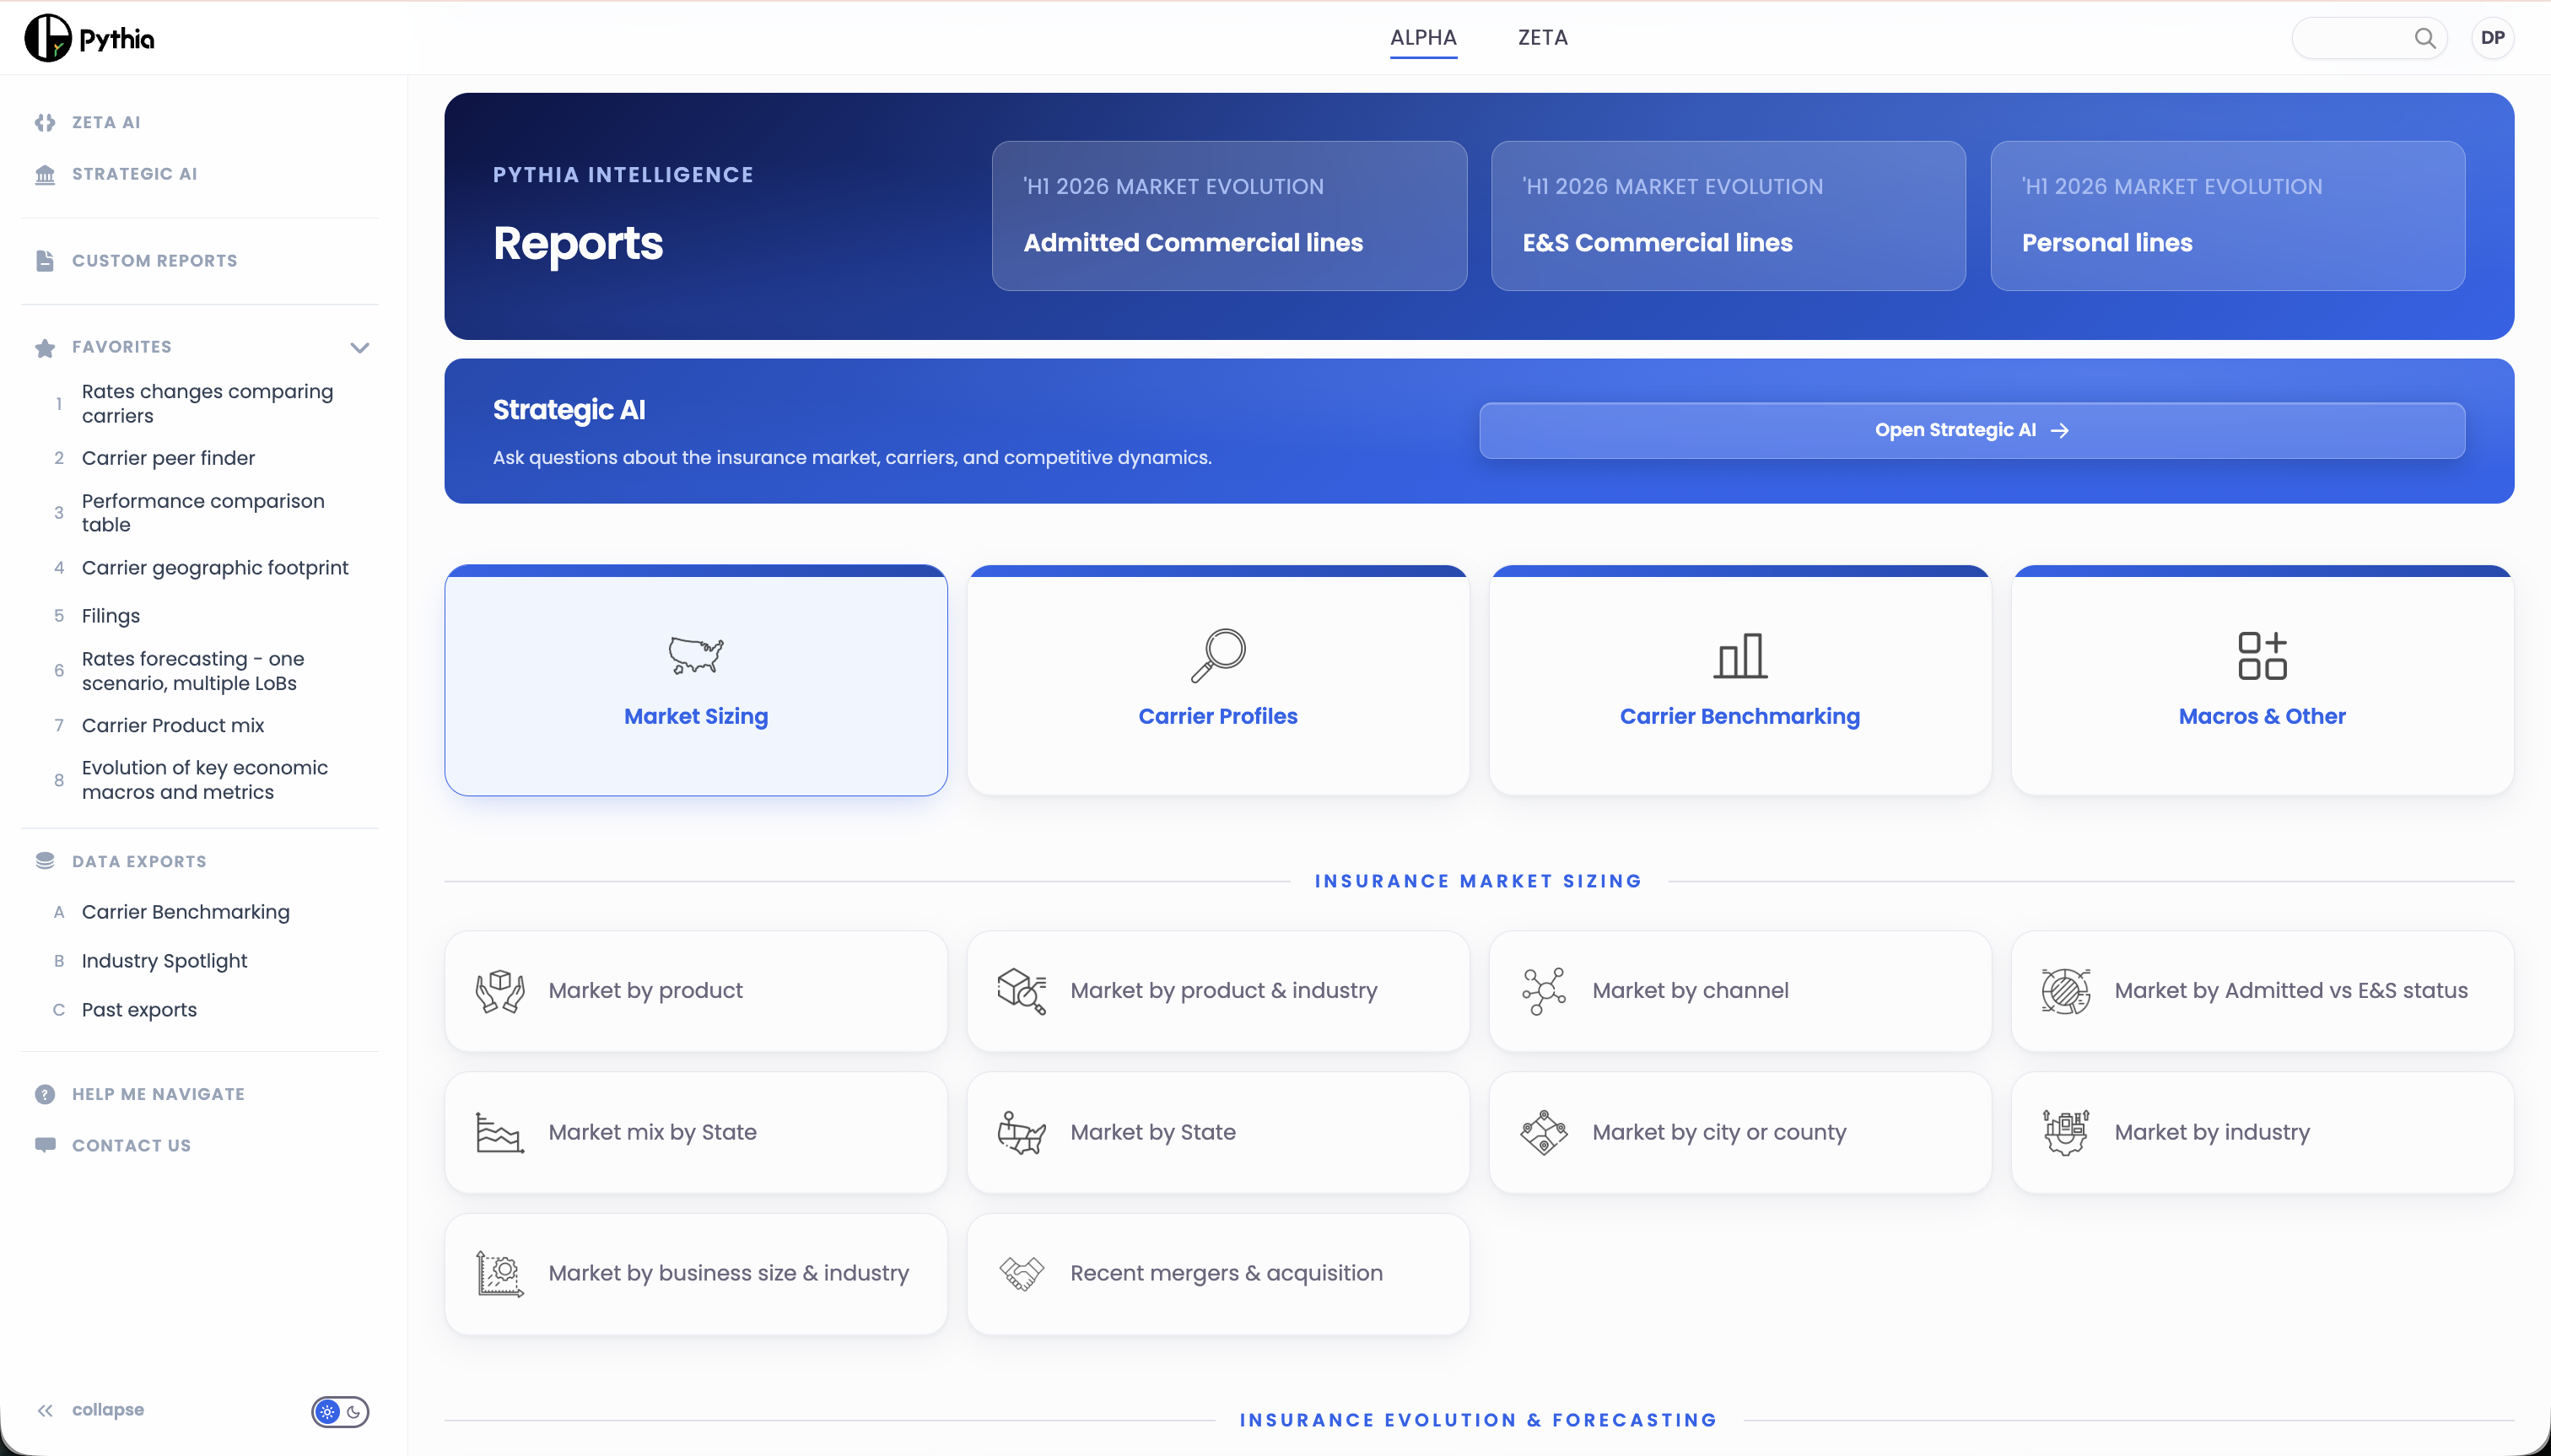
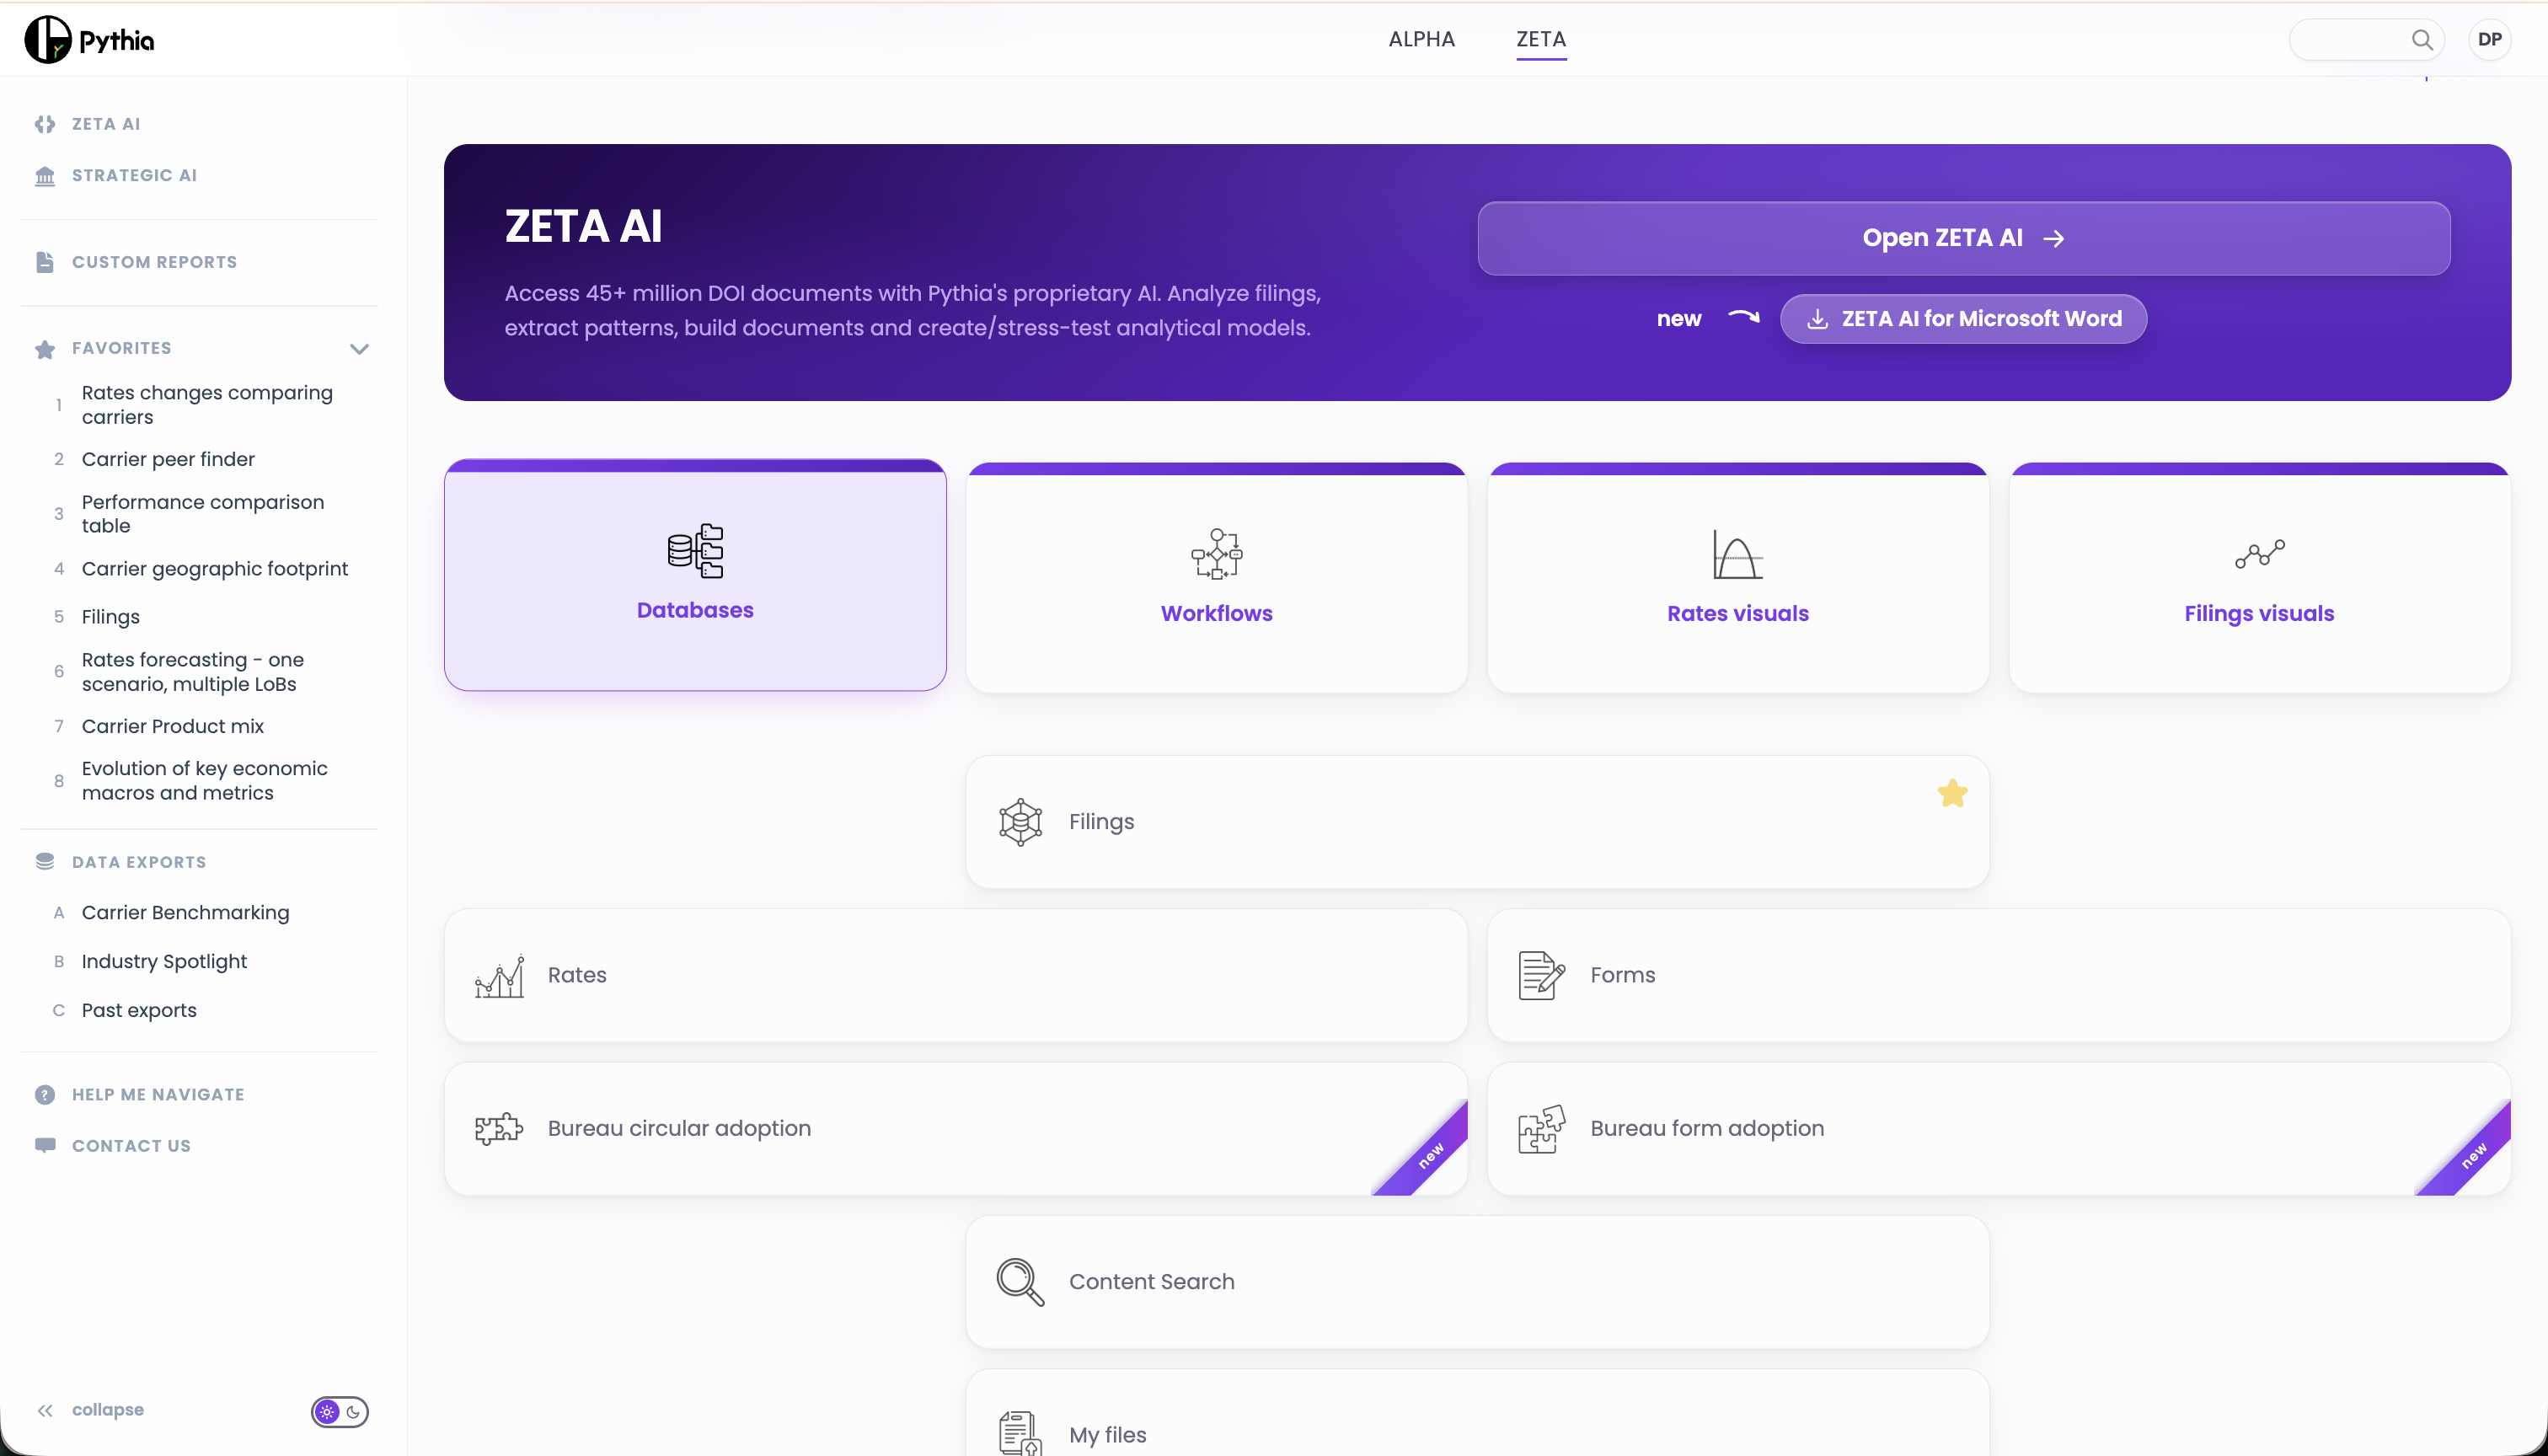
AI-native intelligence platform built for P&C insurance
By combining agentic actuarial AI with proprietary data, Pythia transforms fragmented market and regulatory information into real-time, decision-ready intelligence embedded directly within core insurance workflows.
30 +
years of hard data
450 +
unique industries
3500 +
States, cities, counties
10 +
client size segments
50 +
insurance LoBs
5000 +
writing carriers
10 +
carrier classes
36 M +
SERFF docs ingested
5 M +
transportation policies
100 +
distinct use-cases
Pythia ALPHA & ZETA create a true competitive advantage
From insight to execution, in one system
Pythia ZETA transforms product development pricing, and state management
Leverage actionable, ready-to-use insights to make decisions
Carrier benchmarking
5000+ writing carriers split into 10+ distinct classes (e.g., Direct carriers), with business split into Admitted vs. Excess & Surplus and by customer size segment
10+ highly proprietary metrics and benchmarks by geography, LoB and channel, including
- carrier premium growth decomposed to various drivers (e.g., insurance rate hardening, new client acquisition)
- fixed vs contingent commission rates
Costs split into 30+ subcategories by State, LoB and channel; e.g.,
- incurred claims
- payroll cost for underwriters
- tech investment costs
- advertising cost
Industry Spotlight
Insights on the intersection of geography, industry, company size segment, insurance line of business
30+ years of historical data on:
- Insurance premiums
- Insurance rates
- # of businesses
- # of personal and commercial vehicles (split cars, trucks, buses) and aircrafts
- # of housing units
- Population size
- Revenue
- GDP
- Gross output
- Average insurance spend
- Insurance penetration on GDP/Revenue
- Other measures and KPIs
Forecast modeling
When will the hard market end? What does this mean for you?
Data-driven perspective on the secular evolution of the insurance market by geography, industry and LoB – enabling smart, long-term investments
Scenario-based approach to forecast capacity needs and rates movement, leveraging your team’s assumptions across 10 distinct assumptions categories (30K+ scenarios)